Three-dimensional Diagram of Hue, Value, andChroma
(Compliant with JIS Z 8721 Standard ColorChart)

Hue
There are five basic hues, (H) Red (R), Yellown(Y), Green (G), Blue (B), Purple (P), and the intermediate hues, Yellow-Red (YR), Yellow-Green (GY), Blue-Green (BG), Blue-Purple (PB), and Red-Purple (RP). Each hue has a scale of 0 to 10.
Value
(V) Value represents the ideal black as 0 and the ideal white as 10 on a scale. It quantifies brightness, allowing for comparison of brightness regardless of the hue.
Chroma
(C) Chroma indicates the intensity of the puremcolor components within a hue. Starting from 0 for achromatic colors, as you mix in pure color components, the color becomes increasingly vivid. The upper limit of chroma varies based on hue and value.

The brightness (Value) and chroma (Chroma) of 5GY (according to JIS Z 8721 compliant standard color chart).
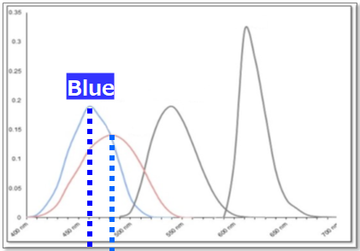
When the human eye receives stimuli, it processes them into three primary colors: red, green, and blue, transmitting the information to the brain, allowing us to perceive color. In industrial applications, the tristimulus values (X, Y, Z) shown in the color matching functions below are used to correspond to the stimulation of these three primary colors. To quantify colors as numerical values, these stimulus values serve as a foundation. Through mathematical conversions (referto conversion formulas), various colorimetric values are derived.

XYZ chromaticity diagram---CIE (International Commission on Illumination)

Color Vision and Tristimulus Values

Isochromatic Functions

Conversion Formula
While tristimulus values are fundamental numerical representations of color stimuli, they alone make it challenging to grasp the actual distribution of colors. Therefore, compared to tristimulus values, it is necessary to use a scale that has nearly uniform perceptual steps for color representation.
This need is addressed by the CIE (International Commission on Illumination) 1976 L*a*b* color space and 1976 L*u*v*.

Comparing the Two Corn Kernels on the Left:Using Numeric Values for Precise Color Differences
When comparing the two corn kernels on theleft, you might employ various expressions such as color intensity, glossiness, and vibrancy. However, using such descriptive terms may leave uncertainties about conveying the complete picture of the color differences. To provide a more concrete representation of the color disparity, numerical values like ΔE*ab can be used, ensuring a precise communication of perceptual color differences.

L*a*b* Color Space Chromaticity Values*

L*a*b* Color Space Solid
The color difference ΔEab, representing the straight-line distance between two perceptual colors in the Lab color space, isgiven by the following formula:


If we designate the first measured color as A, and the second measured color as A', a color difference (ΔE*ab) emerges from A to A'. In this case, the color difference is assessed as described above in terms of L*a*b*.

ΔE*ab represents the distance from point A to point A'. Therefore, a larger numerical value indicates a greater distance, meaning a more significant difference in color.


